


Vermonters with a need for speed now have a way to find out exactly how much they are getting.
Earlier this month, the Vermont Community Broadband Board (VCBB) launched VT Speed Check, a new website where Vermont residents and businesses can check their Internet speed, follow the progression of where high-speed Internet access is available across the state as the state’s CUD’s build out new networks, and get help in fixing problems they may be experiencing with their Internet connections.
In partnership with Ookla — a leading connectivity intelligence and performance metrics company — the new website includes a speed test to determine just how fast (or not) household Internet connections are, a map that anonymously aggregates speed test results, tools to help residents learn how their Internet connection working, and troubleshooting tips to fix problems.
“Taking speed tests is so important,” VCBB Executive Director Christine Hallquist said in announcing the launch. “It’s about transparency and accountability for the individual and the state.”
“Vermonters can run a speed test and troubleshoot problems they’re having with their Internet, and we’ll be able to see results on a bigger scale to help us pinpoint areas that are having challenges and need more focus from us. We are asking all Vermonters to visit VT Speed Check, test your speed, and test it often.”
How It Works
To run the test, residents first have to go to the VT Speed Check website and download the speed test app on their computer.
Results of speed tests produce more accurate location information when the app is downloaded to a computer, officials said, noting how the app does work on mobile devices “but the results aren’t as useful because — unless you’re connected to your home Wi-Fi when you take the test — it will not measure the speed of your home service.” (Also, the map does not work on the mobile app).
Once households take the speed test and get the results, the website will explain what the results mean and offer tips on how to fix many of the common problems associated with getting slower-than-expected speeds.
One handy feature of the website is that it will not only explain what various speed levels mean but also tell the user what features they can and can’t use on their computers.
“For example, two megabits per second can support email, but your video and downloads won’t be great if they work at all. On the other end, consistent speeds at 100 megabits per second will get you seamless video streaming, fast downloads and uploads, and enough capacity for typical home or small office use,” VCBB officials explain.
Additionally, the website breaks down the difference between download speed, upload speed, and latency, each of which is displayed when a speed test is run.
Of course, the more speed tests that are collected, the better the data will be — which is why VCBB officials are encouraging Vermonters to “try testing at different times of the day and different days of the week. You’ll likely find slower speeds during times when more people are online, such as evenings.”
Speed Mapping
After speed tests are taken and the results are aggregated into the VT Speed Check map, participants can explore the map and watch as more Vermonters get connected, providing a window into ongoing speed tests and whether the results are getting better.
CVBB officials say speed test results are counted by location in each hexagon on the map and are grouped by their speed, and shown as a percentage of tests. Areas with less than 100/20 Mbps speeds will have no color, asymmetrical service at or above 100/20 is shown in shades of brown, and symmetrical service of at least 50/50 and capable of 100/100 or greater is shown in shades of green.
At least one completed test is required for results to appear in a hexagon, Herryn Herzog, VCBB Communications, Strategy, and Policy Director, tells ILSR.
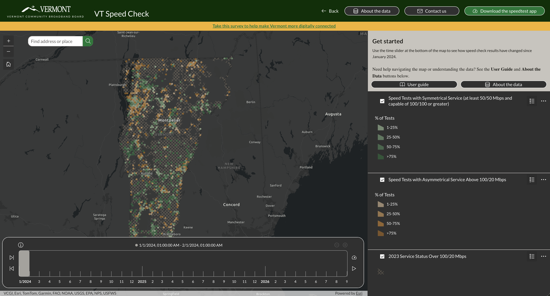
“The map will be updated periodically as additional test results become available. The hex is based on percentage of locations because there are such variations on numbers of locations in each hex. This helps make the symbology more uniform. For example, if there are 4 locations in a hex, as soon as one is served it's the lightest color, if there are 40 locations in a hex, it turns the lightest green once a single test is taken but stays lightest green until unique 11 tests are run in that hex."
The results, Herzog said, “will serve as supplemental data to the FCC’s National Broadband Map. It can provide additional insights into broadband performance across Vermont.”
Herzon also said the VCBB is well aware that some households might be less inclined to participate in this voluntary initiative because they may not understand how to do it or how it can help improve Internet access across the state.
“The VCBB recognizes that people without Internet access face barriers to participating in speed tests. To help address these challenges, the VCBB collaborates with local communities and organizations,” she said, adding how its “pilot device donation program provides devices to restorative justice centers (and) these community partnerships can help identify barriers to participation, expand access to testing, and encourage more Vermonters to contribute data so we can see the results of the ongoing investment and hard work to build out broadband in Vermont, as well as helping people get the most out of their connection.”
While the VT Speed Check website is new, the VCBB is not new to collecting speed test information. From January 2023 through September 2026, the state has tallied a total of 1,454,850 tests, Herzog tells ILSR — a figure that can serve as the baseline for comparison with future test submissions.
“We will receive October test results on Nov. 1, which will represent tests that have happened since the official VT Speed Check announcement and launch,” she said.
A Model For Other States?
What Vermont is doing is something we think is wise for other states to consider implementing.
The FCC’s National Broadband Map is largely based on provider-reported data. And, as a recent GAO report underscored, the map has long been riddled with inaccuracies that make it hard to know where Internet service misses the mark.
A state-administered tool that measures actual speeds at the location level provides data that ISPs can’t or won’t: ground truth that better pinpoints where investments ought to be made — and to track whether new networks are delivering what they promise. To do that properly, it’s important to collect numerous speed tests ideally over multiple years.
(An ILSR search found only nine states that have launched statewide efforts to collect speed test data: Colorado, Minnesota, Washington, Hawaii, California, West Virginia, New York, Pennsylvania, and Maine).
In Vermont, with more than 1.4 million tests already having been collected since 2023 as a baseline, soon Vermont will be able to measure the difference that new networks largely being built by the CUDs are making. We would expect to see a marked improvement, given that the bulk of new connections being built in the state are fiber — the gold-standard of Internet access technologies.
In the meantime, the ask is simple for Vermonters: take the test, and take it often.
For that, a step-by-step video and more resources can be found on the VCBB website, which includes a link to a survey about Internet use, comfort with online tasks, access to devices, and digital technology challenges residents face.
In addition to the speed tests, the survey information — with the responses kept confidential — is also important data to collect, VCBB officials note, because it “will help shape programs for affordability, digital skills and cybersecurity training, and workforce development.”
Header image of speed test courtesy of Pexels.com
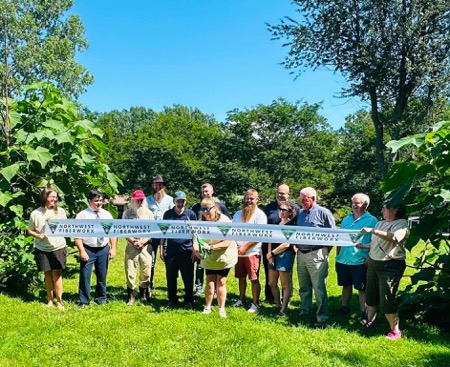
Inline image of Northwest Fiberworx ribbon cutting ceremony courtesy of VCBB Facebook page