
mapping

Content tagged with "mapping"

Related Topics

Old /tags-176

Displaying 111 - 120 of 155

Visualizing Connectivity in North Carolina

At the beginning of the year, our Community Broadband Networks team visited North Carolina as part of the Let’s Connect speaking tour. While preparing for the trip and after returning to Minnesota, we researched and mapped Internet access and broadband funding in the state. Here’s what we found.

Broadband Availability by County

According to Federal Communications Commission (FCC) data, which is riddled with errors and fundamentally overstates coverage, almost 95 percent of North Carolina has access to broadband speeds of a minimum of 25 Megabits per second (Mbps) download and 3 Mbps upload. Despite seemingly widespread connectivity, many rural parts of the state are still not connected. While the FCC data shows that nearly all of urban North Carolina has access to broadband and about 97 percent has access to higher speeds of 100 Mbps/10 Mbps, more than 15 percent of rural North Carolina is entirely without broadband and more than 24 percent lacks access to speeds of 100 Mbps/10 Mbps.

However, far more North Carolinians don't have Internet access than the FCC says, particularly in rural communities. The FCC's data collection method relies on self-reporting by providers at the census block-level, which inherently exaggerates the extent of broadband coverage. Even if a provider offers Internet access to only one home within a census block, the entire census block is counted as served. Rural areas, where the census blocks are large and homes are far apart, are especially harmed by this approach.

View the map below to see which parts of the state have high-speed Internet access, according to FCC data.

For greater detail, download the county-level maps from this Dropbox folder.

Cooperatives Fiberize Rural America: A Trusted Model For The Internet Era (Updated 2019)

Image

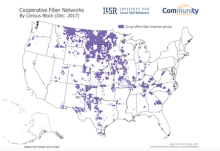
Decades after bringing electricity and telephone services to America’s rural households, cooperatives are tackling a new challenge: the rural digital divide. New updates to our report Cooperatives Fiberize Rural America: A Trusted Model for the Internet Era, originally published in 2017, illustrate the remarkable progress co-ops have made in deploying fiber optic Internet access across the country. 

Download the updated report [PDF] here.

All versions of the report can be accessed from the Reports Archive for this report.

The report features new maps showing overall growth in areas served by co-ops, as well as expanded information about state legislation that supports co-op investment in broadband networks. A few important takeaways:

More than 140 co-ops across the country now offer residential gigabit Internet access to their members, reaching more than 300 communities. 

Co-ops connect 70.8 percent of North Dakota and 47.7 percent of South Dakota landmass to fiber, and residents enjoy some of the fastest Internet access speeds in the nation.

Georgia and Mississippi have overturned state laws banning co-ops from offering Internet access, and other states, including Colorado, Maryland, North Carolina, and Texas, have implemented legislation that will further ease the way. 

Co-ops have proven that this is a model that works. With increased support from federal and state governments, they will continue to connect rural Americans to economic and educational opportunities otherwise denied to them. 

Read Cooperatives Fiberize Rural America: A Trusted Model For The Internet Era [PDF] here.

Report Paints a Clearer Picture of Digital Divide in Pennsylvania

Maps produced by the Federal Communications Commission (FCC) show that the vast majority of Pennsylvanians have broadband access, but anecdotal evidence suggests otherwise. In order to get a clearer picture of on-the-ground broadband access and availability, a team from Pennsylvania State University proposed a research project for the Center for Rural Pennsylvania (CRPA) that would analyze millions of speed tests from around the state. A few staff members from the Institute for Local Self-Reliance were recruited to help with the research: Hannah Trostle and Hannah Bonestroo created the maps for the report and Christopher Mitchell contributed policy recommendations. 

Read the full report here.

A Growing Problem in Rural Counties 

The team collected more than 11 million speed tests in 2018 using the Measurement Lab (M-Lab) platform, which allows users to conduct tests on their actual broadband connections. When the M-Lab’s data was compared to the FCC’s Form 477 speed data, certain discrepancies became apparent. Researchers found that there are actually zero counties in Pennsylvania where at least 50% of residents have access to broadband. 

The findings also showed that not only are median speeds slower in rural counties compared to urban ones, but the discrepancy between FCC data and the measured speeds collected by M-Lab has grown significantly in rural counties over the last few years. This signifies a growing problem for policymakers hoping to bridge rural Pennsylvania’s digital divide. Without a clear and accurate analysis of connectivity, determining where and how funding should be used is difficult. 

Next Steps for Pennsylvania 

Updated Report Shows How Cooperatives Are Bridging the Digital Divide

Decades after bringing electricity and telephone services to America’s rural households, cooperatives are tackling a new challenge: the rural digital divide. New updates to our report Cooperatives Fiberize Rural America: A Trusted Model for the Internet Era, originally published in 2017, illustrate the remarkable progress co-ops have made in deploying fiber optic Internet access across the country. 

“Cooperatives should be the foundation for bringing high-quality Internet service to rural America... Small towns and farming communities need robust Internet service to support their local economies, educate themselves, and generally improve their quality of life. Cooperatives have quietly proved that they can build Fiber-to-the-Home networks that are capable of speeds of greater than 1 Gigabit per second (1,000 Mbps). More than 140 cooperatives offer gigabit service to residents or businesses.”

The report features new maps showing overall growth in areas served by co-ops, as well as expanded information about state legislation that supports co-op investment in broadband networks. A few important takeaways:

  • More than 140 co-ops across the country now offer residential gigabit Internet access to their members, reaching more than 300 communities. 
  • Co-ops connect 70.8 percent of North Dakota and 47.7 percent of South Dakota landmass to fiber, and residents enjoy some of the fastest Internet access speeds in the nation.
  • Georgia and Mississippi have overturned state laws banning co-ops from offering Internet access, and other states, including Colorado, Maryland, North Carolina, and Texas, have implemented legislation that will further ease the way. 

Co-ops have proven that this is a model that works. With increased support from federal and state governments, they will continue to connect rural Americans to economic and educational opportunities otherwise denied to them. 

Read the full report [PDF] here.

NRECA Fact Sheet: Electric Cooperatives Could Bring High-Speed Internet To Another 6.3 Million Households

Cooperatives are building the next-generation networks that will support rural areas long into the future. We’ve covered this extensively at ILSR as we have gathered materials on community networks from across the country into one place. We want to share this fact sheet from National Rural Electric Cooperatives Association (NRECA) on how electric cooperatives are well-situated to bring high-speed Internet service to another 6.3 million households.

6.3 Million Households Have a Co-op, But No Broadband

The fact sheet features an insightful map of the areas within electric cooperative service territories that do and do not have broadband. (Note: The FCC defines broadband as a speed of at least 25 Mbps download and 3 Mbps upload.) Many telephone and electric cooperatives can take the credit for bringing needed connectivity to their communities. For example, more than 90 electric cooperatives across the U.S. have built Fiber-to-the-Home (FTTH) networks, which offer some of the fastest Internet service in the country.

The NRECA fact sheet, however, reveals the 6.3 million households in rural electric cooperative service areas that still need high-speed Internet access. These areas are primarily in the Midwest and the South. Creating pathways for electric cooperatives to extend Internet service is increasingly a priority in a number of these states, and state legislatures are now passing laws to empower both electric and telephone cooperatives. NRECA offers more policy recommendations to continue the momentum.

You can learn more about the ways rural cooperatives are bringing better connectivity to rural areas by reading our 2017 report, Cooperatives Fiberize Rural America: A Trusted Model For The Internet Era.

Check out the NRECA fact sheet, and drop us a line if you know of more resources to add to the ILSR’s Community Networks Initiative archives. 

Applying for ReConnect Funds? Check Out This New Mapping Tool

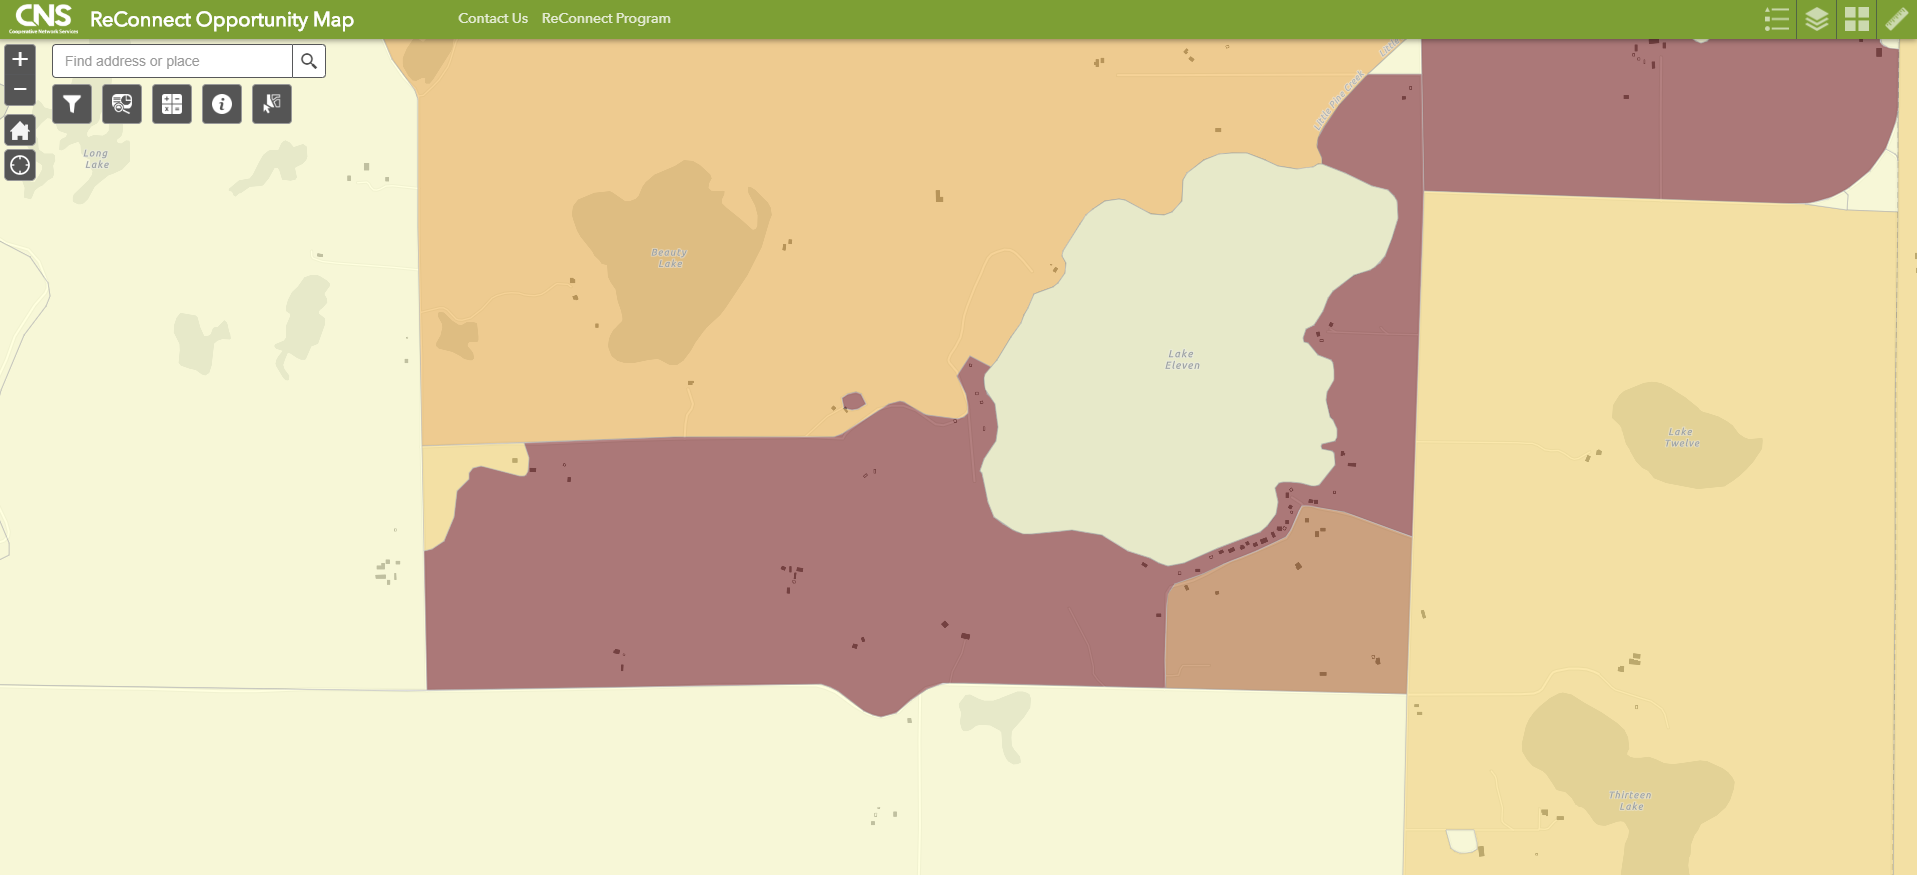
The federal government shutdown continues to drag on, but people heading up rural broadband projects are not waiting until it’s over to investigate federal funding sources. Tools like the ReConnect Opportunity Map from Cooperative Network Services (CNS) will help reduce some of the uncertainty and time required to prepare an application for this and other funding opportunities.

The GIS tool focuses on the ReConnect grant program’s criteria, which will allow users to quickly identify census blocks across the U.S. that are eligible for funding. CNS has also added special color-coding to display density of households and included information about those census blocks to help complete the applications. Examining density of households per road mile allows planners to more quickly prepare an application and establish a cost estimate. The map digs down even further to give information on housing units, which will help with refining deployment costs.

The tool also allows users to define deployment areas on the map and run reports that include census block identifiers, households, and populations per mile. Even if the specific identified area doesn’t qualify for ReConnect funding, the information can be used for other purposes, such as for a potential project that might qualify for other funding or might be of interest to an Internet access provider looking to expand in the area.

Check out this sample screenshot and the explanation below:

CNStool-screengrab_0.png

View a larger version of the screenshot.

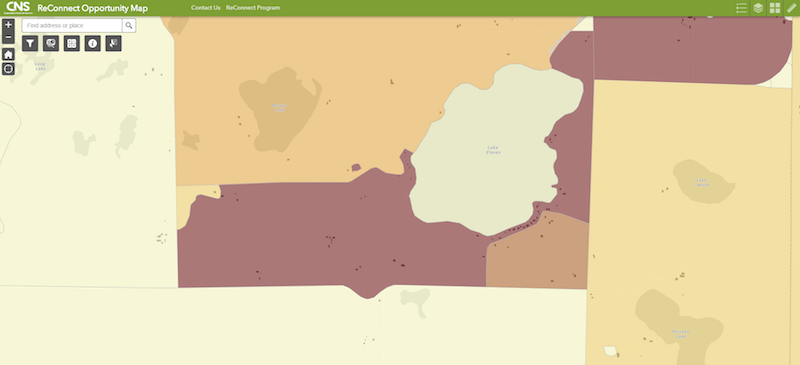
This image of an area in Minnesota indicates census blocks that do not currently have broadband speeds over 10 Megabits per second (Mbps) download and 1 Mbps upload. The blocks are color-coded based on the number of housing structures per road mile (darker = more housing units per road mile). Small dark spots are structures. The number of households per road mile shading allows users to quickly identify areas that may make the most sense to target since road miles generally equate to fiber construction corridor miles.

More Than ReConnect

Colorado Map: Local Authority Expanding Across the State

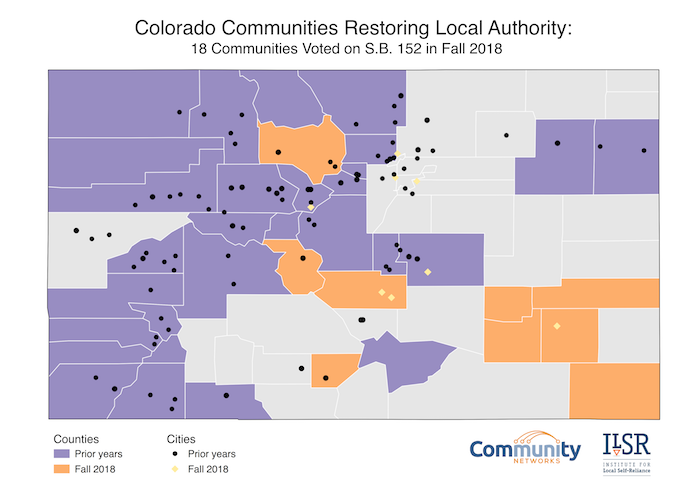
A total of 40 counties and 102 municipalities have now chosen local telecommunications authority by passing ballot measures to opt out of restrictive state law. Last November, 18 counties, cities, and towns voted to join the expanding list of communities opting out of SB 152, which revoked local telecommunications authority in 2005. We decided to update our map to get a new visualization of what the situation now looks like in Colorado. 

Take a gander:

map-2018-fall-SB152-small.png

Moving Across the State

The map, updated by Intern and Mapping Maven Hannah Bonestroo from an earlier version created by former Research Associate and Visualization Virtuoso Hannah Trostle, shows how the decision to opt out is sweeping from region to region. Earlier referendums centered in the Mountain and into the Western Slope and San Luis Valley communities. During this past election cycle, most of the counties bringing the issue before voters were in the Plains region.

In past years, mountain towns, often resort communities, were looking for better connectivity when big ISPs considered deployment too challenging and expensive in their geographies. Now, it appears that the rural and less populated Plains communities are seeing value in reclaiming local authority.

With fewer population centers in the Plains region, farms and ranges fill much of this section of the state. Large, corporate ISPs don’t consider this type of landscape profitable due to the lack of population density, however, farmers and rangers require high-speed Internet access for various reasons. Crop and livestock monitoring and realtime reporting are only a few of the ways 21st century agricultural professionals use broadband.

Colorado’s Free Communities

In Colorado, there are 271 active incorporated municipalities, 187 unincorporated Census Designated Places (CDPs) and other small population centers that are outside of CDPs or municipalities. To date, the 102 municipalities that have elected to opt out of SB 152 have all been incorporated municipalities, or approximately 38 percent.

Beyond Mapping With VETRO FiberMap - Community Broadband Bits Podcast 333

Whether it’s a local government or ISP that chooses to invest in fiber optic infrastructure accurate, dependable, mapping is critical before, during, and after initial deployment. This week’s guests deliver that service through VETRO FiberMap. CEO Will Mitchell and COO Sean Myers join Christopher to discuss their mapping platform, the creative ways they use it, and their expectations for the future of fiber networks.

Will and Sean explain how in working with ISPs and local communities interested in providing better connectivity, they’ve found that they’ve been able to adjust FiberMap to deliver specialized services. FiberMap has provided the information needed to not only deploy, expand, and manage fiber networks, but it has also allowed companies and publicly owned networks to develop marketing plans and expand their future visions.

Christopher, Will, and Sean discuss GIS data, where they can access it and where it’s more challenging to obtain this data that is so important to creating a successful deployment plan. They also get into some of the many projects where local communities have used VETRO FiberMap, including some of the better-known deployments in Maine, where recent changes in the law have encouraged an increase in regional efforts.

Check out this video and learn more about VETRO FiberMap at their website.

This show is 33 minutes long and can be played on this page or via Apple Podcasts or the tool of your choice using this feed

Transcript below. 

We want your feedback and suggestions for the show-please e-mail us or leave a comment below.

Listen to other episodes here or view all episodes in our index. See other podcasts from the Institute for Local Self-Reliance here.

Thanks to Arne Huseby for the music. The song is Warm Duck Shuffle and is licensed under a Creative Commons Attribution (3.0) license.

Broadband Competition in the Rochester Region: Reality vs Federal Statistics

Image

In this policy brief, we highlight the gulf between FCC broadband data for Rochester and what’s actually available to residents by examining local competition. Download the policy brief Broadband Competition in the Rochester Region: Reality vs Federal Statistics here.

Rochester Competition: Not All it Appears to Be

The city, home to the world-famous Mayo Clinic, had previously considered building a municipal network, but the idea was dropped, in part because of the incorrect perception that enough competition already exists between Internet service providers. Our analysis and the corresponding maps reveal that broadband competition in the region is more limited than many realize.

The policy brief concludes:

“Overall, Charter and CenturyLink compete for the urban center of Rochester, while the rural areas rely almost exclusively on fixed wireless for broadband service. Even where residents have a choice in broadband, anyone looking for speeds in excess of 40 Mbps will almost certainly have to subscribe to Charter Spectrum. This is why more cities, especially those with municipal electric services, are considering how smart local investments can ensure more consumer choices and a working market for these essential services.”

Shortcomings of FCC Data

As we’ve covered before, the FCC collects data by census block, which incorrectly inflates broadband access and competition data. Internet service providers self-report and describe an entire block as “served” even if they can only connect one address in that census block.

We describe the problems with self-reporting in the policy brief:

Policy Brief: How FCC Data Has Failed Rochester, Minnesota

It’s no secret that the Federal Communications Commission’s (FCC’s) broadband data is unreliable. Many people, including U.S. Senators, have pointed out how federal data collection methods overstate connectivity across the country. Rochester, Minnesota, is no exception. In this policy brief, we highlight the gulf between FCC broadband data for Rochester and what’s actually available to residents by examining local competition.

Download the policy brief Broadband Competition in the Rochester Region: Reality vs Federal Statistics here.

What’s Going On in Rochester

The city, home to the world-famous Mayo Clinic, had previously considered building a municipal network, but the idea was dropped, in part because of the incorrect perception that enough competition already exists between Internet service providers. Our analysis and the corresponding maps reveal that broadband competition in the region is more limited than many realize.

Shortcomings of FCC Data

As we’ve covered before, the FCC collects data by census block, which incorrectly inflates broadband access and competition data. Internet service providers self-report and describe an entire block as “served” even if they can only connect one address in that census block.

We describe the problems with self-reporting in the policy brief:

“Large, de facto monopoly providers have incentives to overstate their coverage and territory to hide the unreliable and slow nature of their service in many communities. Small providers often have trouble completing the FCC Form 477. . . Larger providers have plenty of staff to handle the form and seem to benefit the most from its flaws, as this data is often used to determine whether government programs should invest additional funds into an area, often by a competitive grant program. Areas that appear to be well covered will not result in more investment, leaving the incumbent providers without fear of competition.”