
Not All Affordable Connectivity Program Enrollees Are Using the Benefit: A Look into 30 Major Metro Areas
Since the launch of the Affordable Connectivity Program last January, millions of households have benefitted from the $30/month connection subsidy to help pay for their broadband bills. The program serves as a necessary bridge in a failed marketplace, dominated nationally by a small number of regional monopolies driven by shareholders to charge the highest price possible.
Along the way, ILSR and a host of other research and advocacy organizations have been digging into the American Connectivity Program (ACP) data in order to better understand how the program has operated over the last year, and how we can work collectively to improve education and outreach efforts and make sure as many households as possible will benefit. From this work we created an ACP Dashboard to collect and visualize useful data to support the critical work of digital navigators, nonprofits, and local governments.
Explore the Affordable Connectivity Program here, and read more about why we created it.
Reckognizing the Gap
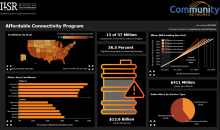
In addition to tracking how much of the $15.5 billion fund ($1.3 billion was carried over from the Emergency Broadband Benefit and $14.2 billion was allocated for the ACP] is left and predicting when it’ll run out (April 2026 at current rates), keeping an eye on state- and zip-code level use and enrollment, and following what types of connections households are using the benefit to pay for, an important part of this work has been tracking data across major metropolitan areas across the country.
As we continue to analyze the data and refine our tools to support work at the local level, we have found that the percentage of households in major metro areas (and likely elsewhere) that are actually using the program is smaller than the percentage of households enrolled in the program.