Mapping The Urban-Rural Digital Divide In Georgia

Internet access isn't effective when it takes forever to load a single webpage or when subscribers spend hours babysitting their computers to ensure files make it through the upload process. At the Institute for Local Self-Reliance, we create maps analyzing publicly available data to show disparities in access and highlight possible solutions. We've recently taken an in-depth look at Georgia and want to share our findings with two revealing maps. According to the FCC's 2018 Broadband Deployment Report, 29.1 percent of the state's rural population lacks broadband access, but only 3 percent of the urban population shares the same problem. Cooperatives and small municipal networks are making a difference in several of these rural communities.
Technology Disparities Across the State
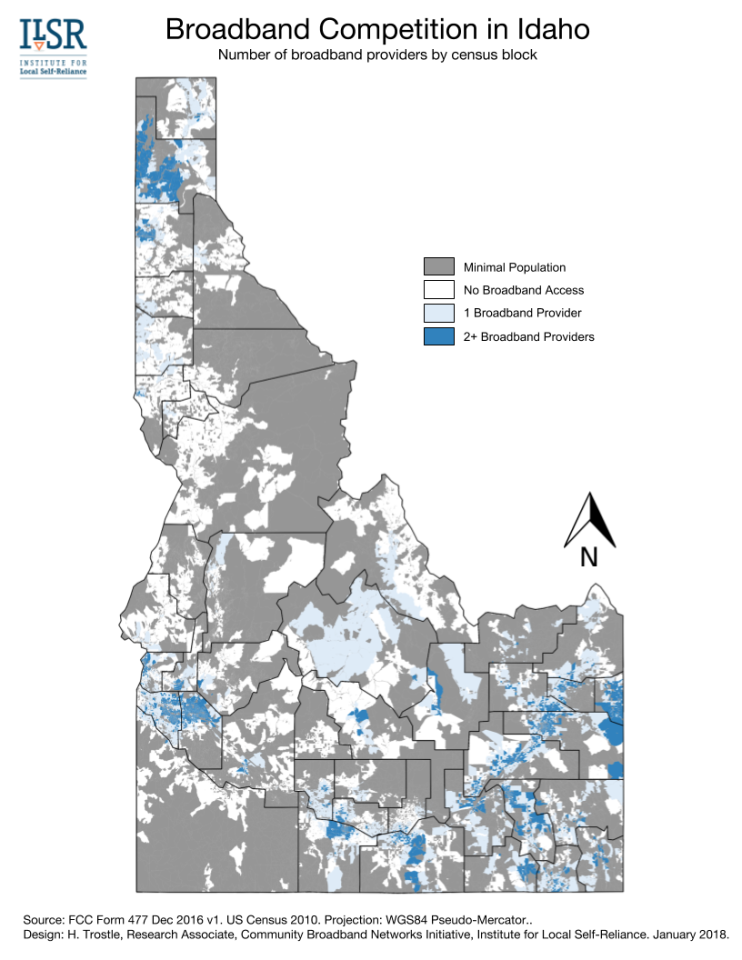
The map below shows what kinds of technology Internet Service Providers (ISPs) are using to offer Internet service to homes or businesses in Georgia. To differentiate areas of the state, the lines represent the subdivisions within counties. Our analysis focuses on wireline technologies, specifically fiber, cable, and DSL. Satellite and fixed wireless services are too dependent on the weather and the terrain for our analysis.

In rural Georgia, premises with wireline access most often rely on DSL; cable and fiber tend to be clustered around towns and cities where population density is higher. Google, for instance, operates a fiber network within Atlanta, Georgia. The large amount of fiber in the eastern half is the Planters Rural Telephone Cooperative, one of the many rural cooperatives that are taking steps to help rural communities obtain the access they need to keep pace with urban centers.